


A case study on introducing neighbourhood-level marginalization data into the EMR using bot technology
Social determinants of health (SDoH) are social factors, including education, housing, employment, and social support, that can impact patient outcomes. SDoH are recognized as having an important impact on health and mortality with strong evidence of the benefits of addressing people’s unmet social needs1. The availability of neighbourhood-level measures of SDoH in the EMR would enable clinicians to engage in patient-centred and community-oriented care that factors in the neighbourhood context where individuals grow and live3. However, there are no standardized approaches to collecting SDoH data in primary care workflows and thus there is a lack of consistent and complete SDoH data in EMRs2. Such challenges hinder the ability of clinicians to work towards improving health outcomes by addressing complex social factors that contribute to patient health.
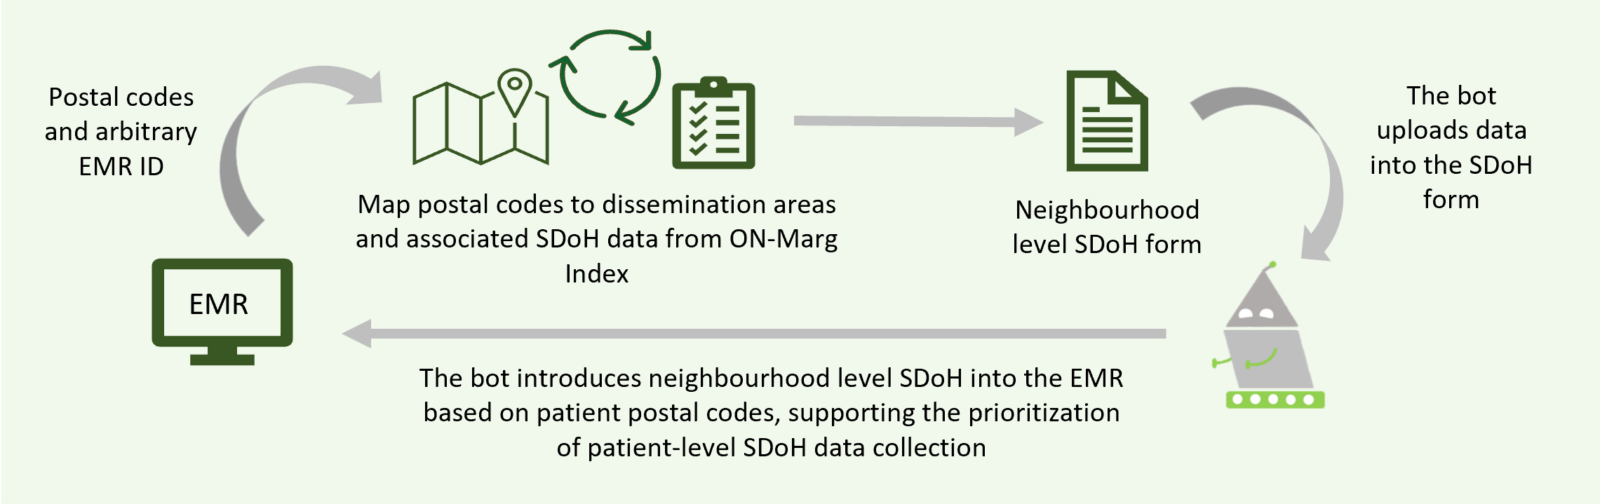
To address the need for SDoH information in primary care, a new robotic process automation (RPA) or ‘bot’ process is used to introduce neighbourhood-level SDoH data based, on patient postal codes, into the EMR (Figure 1). This bot functions by inserting a form in the EMR within each patient chart, which presents the social complexity level of the neighbourhood where the patient lives, based on their postal codes. A distribution analysis of the neighbourhood social complexity levels of a site’s patient population is also conducted, providing more insight into a site’s patient population and enabling clinicians with contextual knowledge to better meet their patients’ needs.
SDoH data is retrieved from the Ontario Marginal (ON-Marg) index, which presents data on four SDoH dimensions: residential instability, material deprivation, dependency (concentrations of people who don’t have income from employment), and ethnic concentration data. Notably, the data from the ON-Marg Index is retrieved from the Canadian census and is available at a small area level and public health unit level (otherwise referred to as a dissemination area) that can be mapped to specific postal codes. The SDoH complexity form that the SDoH Bot introduces into the EMR to help inform clinician decision-making was co-designed with feedback from clinicians, researchers, and an equity specialist.
Key takeaways
Robotic process automation introduces neighbourhood-level social determinants of health data into primary care EMRs based on postal codes and data from the Ontario Marginalization Index. This technology supports population management efforts by enabling clinicians to familiarize themselves with the contextual factors of the neighbourhoods in which their patients reside and make better-informed decisions based on this information.

I reference the social determinants of health form all the time because it’s in an area of my EMR that I look at often. The form has value. It’s simple for me to incorporate into my practice. I can easily see the neighbourhood-level social determinants of health complexity (low, medium, high) for my patients. The information helps me provide a more complete assessment. It helps direct the intensity of family health team resources I should refer patients to in the community. Knowing this neighbourhood-level data supports equitable team-based care and the objectives of [Ontario Health Teams].
Dr. Kristen Farn, Family Physician
First Medical Group Orillia (Participating Site)
Highlighting the Population Differences Across Individual Sites, and as Compared to Ontario-level Data
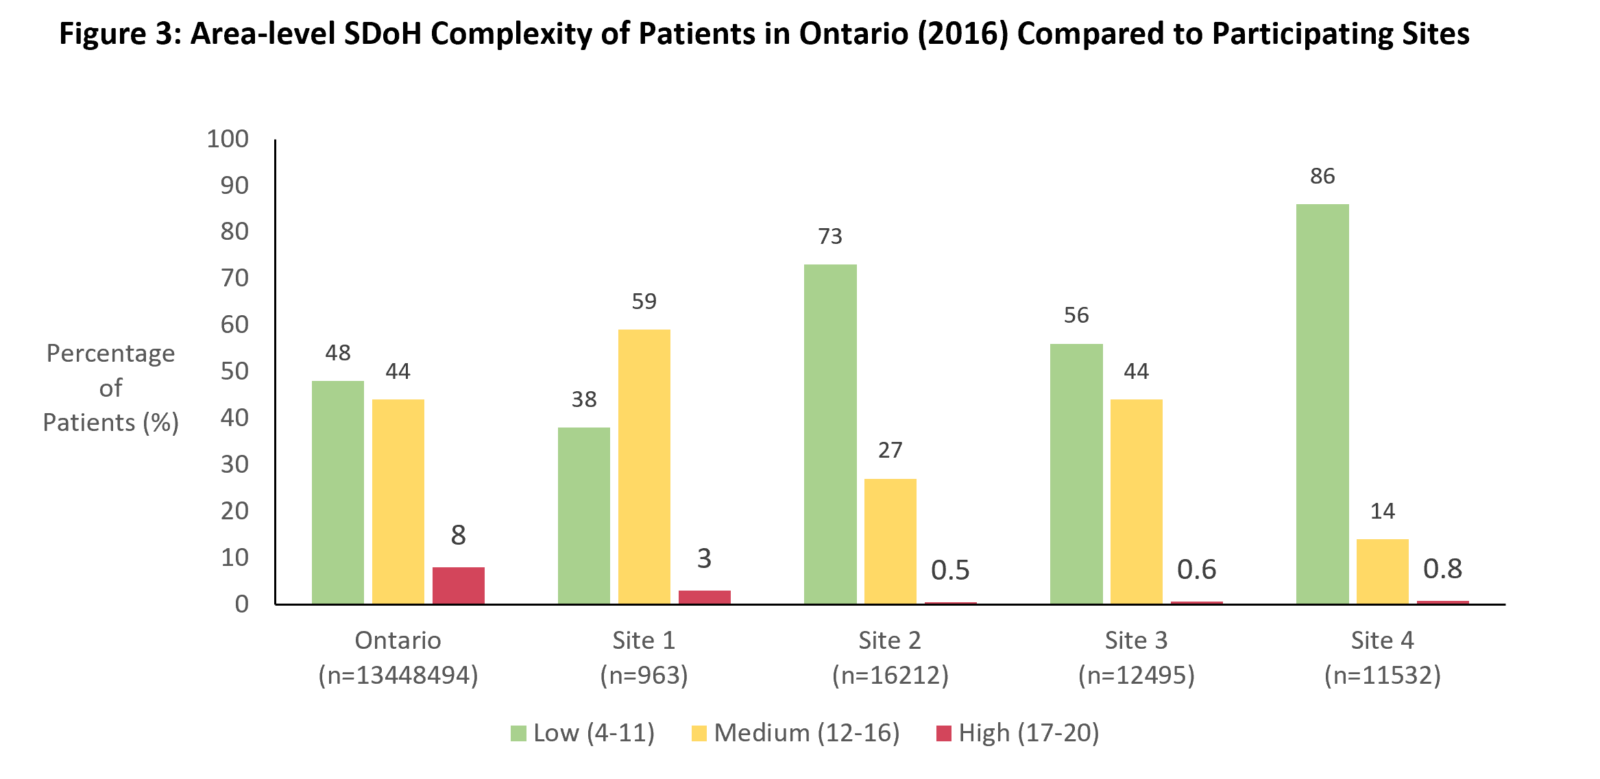
It is important to note that the data provided by the bot was personalized neighbourhood-level data for each clinic based on their patient’s postal code information. The distribution analysis of the neighbourhood SDoH complexity levels was conducted for four primary care sites, across a total of 41,202 patients. Figure 3 shows the distribution of patients at these sites who fall into low, medium, and high levels of neighbourhood SDoH complexity, as compared to the Ontario averages.
This solution flags a small percentage of patients living in high-SDoH complex areas at each given site and provides a new dimension of information to support sites, care teams, and clinicians, to optimally meet their patient needs, based on their social context, and has the potential to change the approach of care especially for these patients living in higher SDoH complexity areas. It is important to note this neighbourhood-level data does not always reflect the situation each patient is in, but it provides a starting place for clinicians to act on.
Neighbourhood SDoH Data Supports Population Health Management Efforts
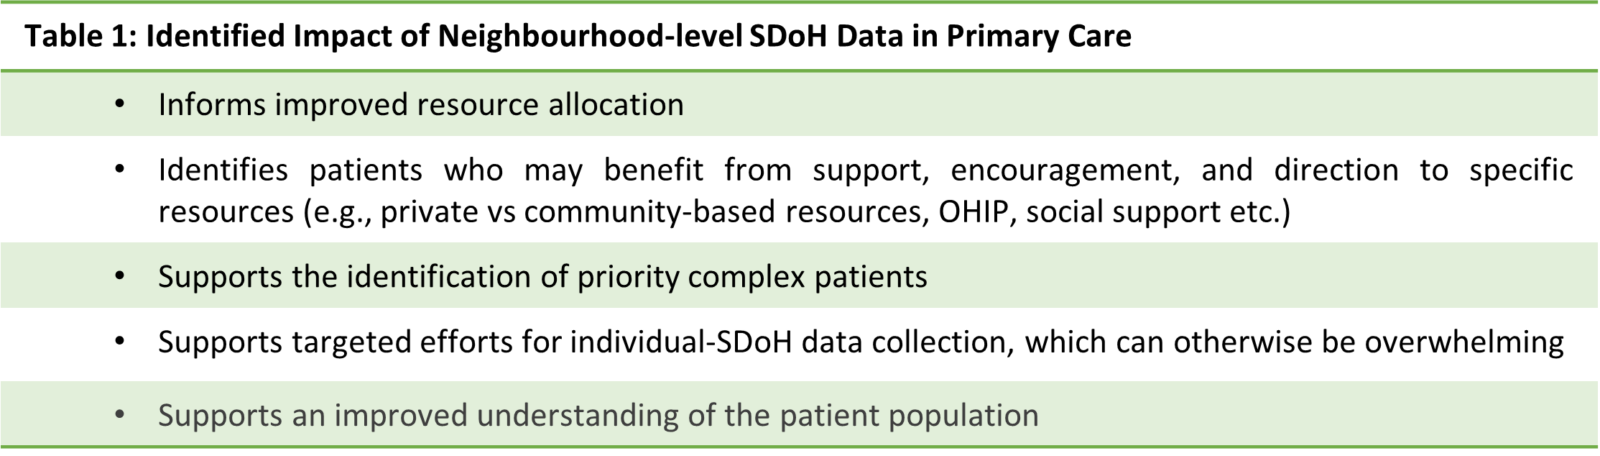
Clinicians shared that the neighbourhood SDoH complexity level data and distribution analysis were informative at the population level and could support clinicians and care teams with resource allocation and making more socially informed decisions when directing patients to resources for their care. Moreover, clinicians shared that it is important for clinicians to advocate for patients to use these community resources.
Introducing Neighbourhood-level SDoH Data to Primary Care
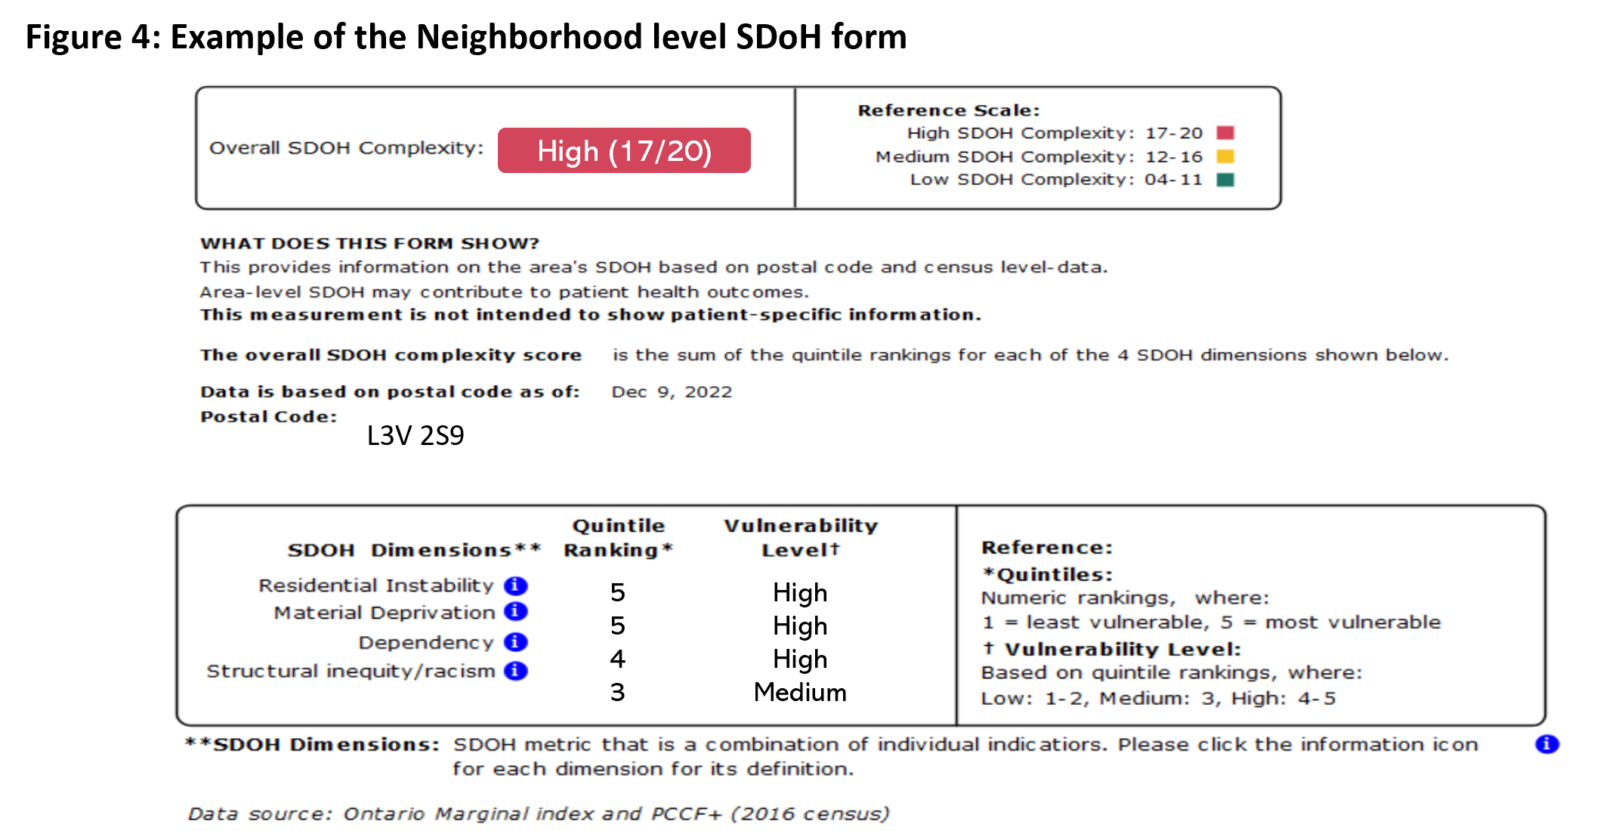
The form provides quintile rankings of each of the four dimension from the ON-Marg Index. The sum of the quintile rankings across the four dimensions is taken to provide an overall neighbourhood SDoH complexity score; overall SDoH complexity is considered low from 0-11, medium from 12-16, and high from 17-20 (4). The SDoH form that the bot implemented in the EMR can be referenced below (Figure 4).
1Gerteis, J., & Booker, C. (2021). IDENTIFYING AND ADDRESSING SOCIAL NEEDS IN PRIMARY CARE SETTINGS . https://www.ahrq.gov/sites/default/files/wysiwyg/evidencenow/tools-and-materials/social-needs-tool.pdf
2Andermann, A. (2016). Taking action on the social determinants of health in clinical practice: a framework for health professionals. Canadian Medical Association Journal, 188(17–18), E474–E483. https://doi.org/10.1503/cmaj.160177
3Jonnalagadda, P., Swoboda, C. M., & Fareed, N. (2020). Using area-level measures of social determinants of health to deliver improved and effective health care. Journal of Hospital Management and Health Policy, 4, 38–38. https://doi.org/10.21037/jhmhp-20-100
4van Ingen, T., & Matheson, F. I. (2022). The 2011 and 2016 iterations of the Ontario Marginalization Index: updates, consistency and a cross-sectional study of health outcome associations. Canadian Journal of Public Health, 113(2), 260–271. https://doi.org/10.17269/s41997-021-00552-1
Interested in learning more?
Interested in partnering with us or learning more about
what we can offer you? Please reach out here.
Get the latest resources and insights
-

Webinar on leveraging AI scribes for your ideal practice (part 1)
Sharing some tips, tricks, and key takeaways from our Ideal Primary Care Practice Model webinar,…
-

Reducing no show rates through the use of eReferral
Missed appointments (no-shows) are a significant issue in primary care settings,1,2 with many medical care…
-

Patient experience with eReferral in Ontario Health North Region
Patients who are emailed appointment information and reminders report an improved healthcare experience and prefer…
-

How AI scribes enable better interactions with patients during appointments
AI scribes are improving patient-clinician interactions by reducing administrative tasks, allowing clinicians to be more…